Upon completion of a calculation the Results window will open.
Cluster Level Combobox: The results at different cluster levels can be selected. Selection will update all solutions and the result tables.
Solutions Combobox: The results are ordered according to the RMS differences. Selection of a result will update all tables.
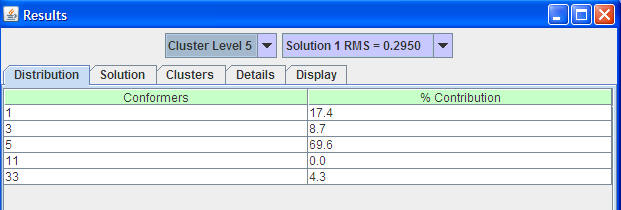
1. Distribution tab:
Distribution tab entails the % distribution of the conformations in the current solution. Selection of a table row will update the molecular area to display the selected conformer.
Selection of multiple conformers ( pressing Control or Command key with the mouse left click) will update the molecular area where the conformers are overlayed according to their center of mass.
2. Solutions tab:
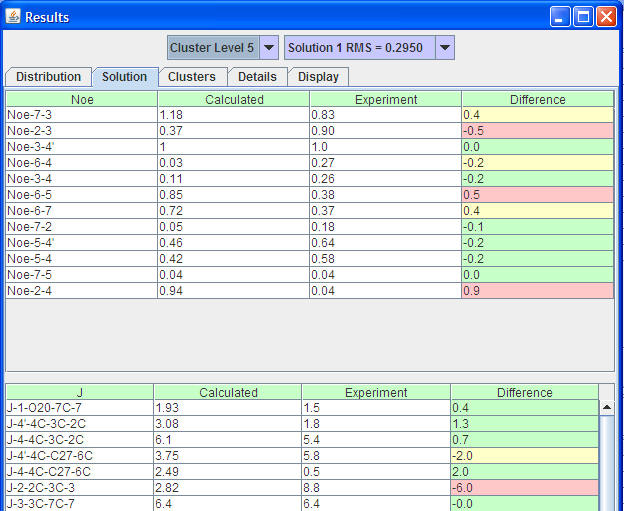
The solutions tab entails the calculated and experimental values and the difference. The color coding enables to easily visualize the calculated parameters with high error margin. Selection of a row or multiple rows will cause the displayed conformations to overlay according to the atoms corresponding to the selected parameters.
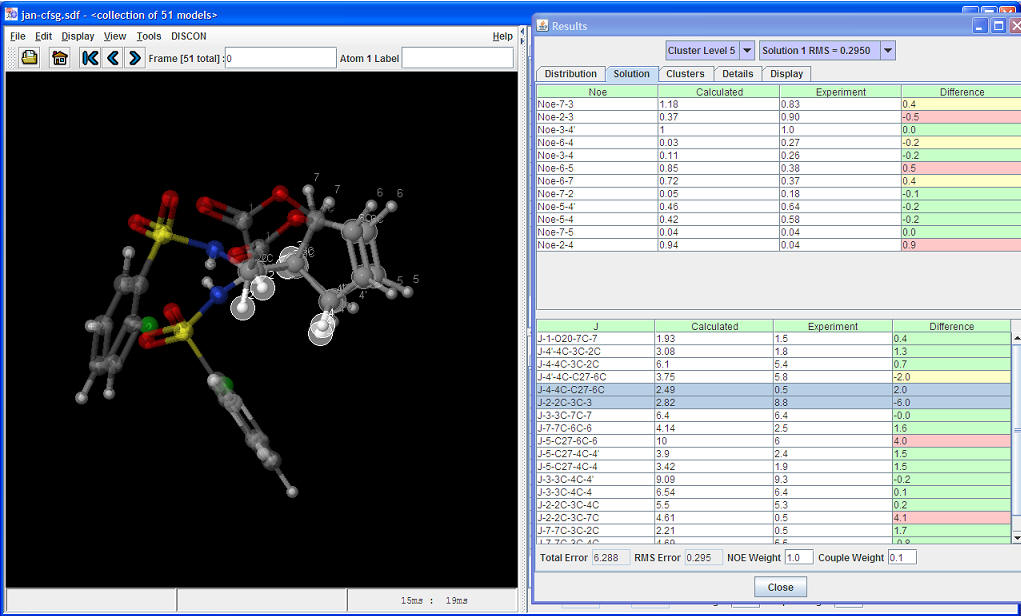
Upon selection of the rows the corresponding atoms will be highlighted as white halos for an easier view. This restricted overlaying process is useful for understanding the differences in conformations or conformational preferences of certain bonds or regions of the molecule.
Error Pane:
The total and RMS Errors of the current solution is listed. The weights of NOE and J values in error calculations can be set. The total errors can also be compared to the errors of single conformations in the NMR error panel of the main window.
3. Clusters tab:
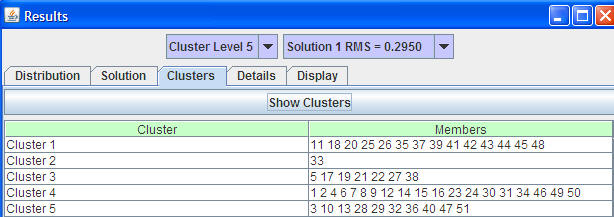
Clusters tab lists the members of the clusters. Selection of a row in the table populates the molecular display area with the selected conformations. The conformers will be overlayed based on the center of mass. User should check if the clustering was successful by visualizing the cluster members.
The "Show Clusters" button will open the clustering schema.
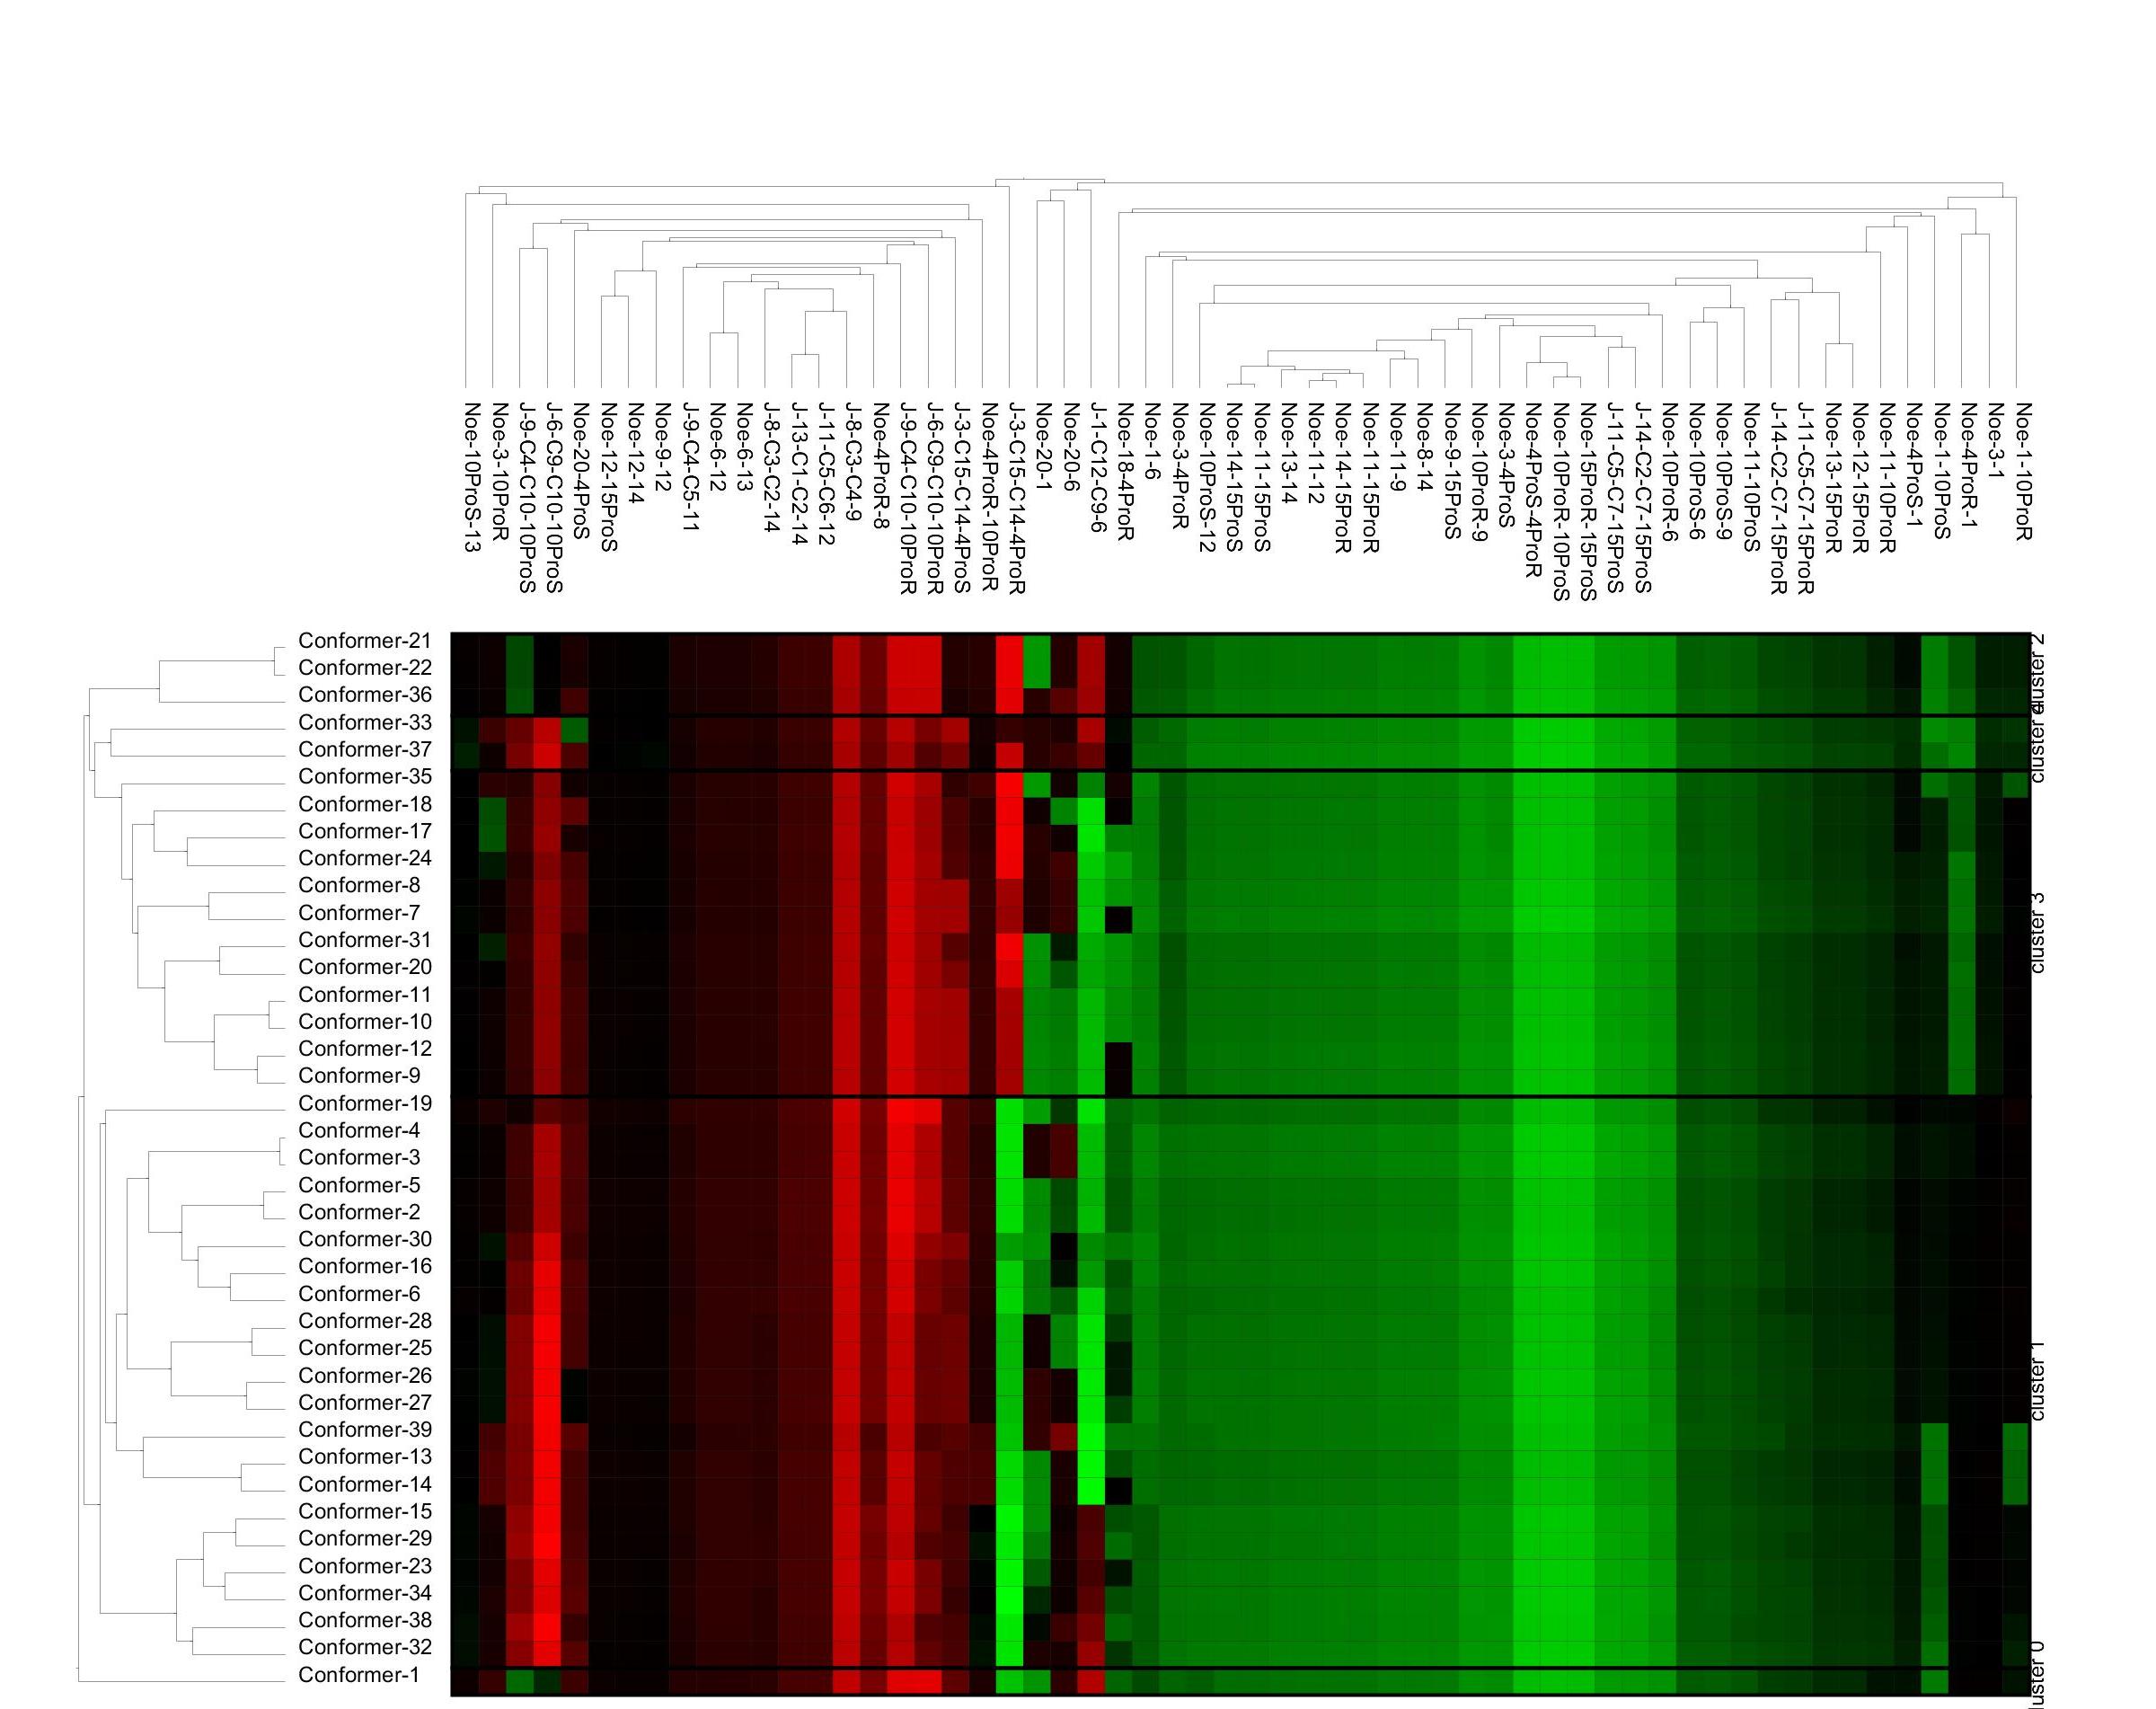
The image incorporates dendogram of the conformers as well the NMR variables. The hierarchical clustering is illustrated in a color scheme where the lowest value of a parameter is shown in red where the largest value is colored in green. If some variables are colored same in all conformers they are not distinctive in separating the conformers and can be omitted for further analysis.
| Prev | Up | Next |
| DISCON Viewing Results | Home | Output Details |